Working Papers/Publications
【May 27, 2019】David von Hippel, “Methods for Refining Estimates of Cumulative DRPK Uranium Production” (PSNA-WP-8)
2019-05-27
Methods for Refining Estimates of Cumulative DRPK Uranium Production
David von Hippel
Nautilus Institute Senior Associate
PSNA Working Paper Series (PSNA-WP-8)1
May 27, 2019
Summary
This paper summarizes the history of what is known about uranium mining in the DPRK; describes the major uncertainties regarding DPRK uranium production; notes some of the key techniques, as used in preparing estimates of nuclear sector activity in other nations, that might be available to assist in narrowing the range of estimates of DPRK uranium and processed fissile material production; summarizes estimates of enriched uranium and plutonium production prepared by other authors; describes existing estimates of the amounts of fissile materials used in nuclear weapons tests and exported; provides a demonstration of the potential impact of remote sensing methods and testing in the DPRK in reducing uncertainties in cumulative historical uranium production, and thus in fissile materials inventories; and, offers conclusions, resulting from the potential impacts of uncertainty reduction approaches, as to which verification procedures should be key targets during negotiations with the DPRK.
1 Introduction and Statement of Problem
Recent weeks and month have seen what appears to be a series of improvements in relationships between the Democratic People’s Republic of Korea (DPRK) and the international community. In particular, summit meetings between Republic of Korea (ROK) President Moon and North Korean leader Kim Jong Un, a meeting between Kim Jong Un and United States President Donald Trump, and advancing planning for a second Trump-Kim summit have raised hopes for progress in talks to “denuclearize” the DPRK. Reaching agreement on, and then implementing a process of dismantling the DPRK’s nuclear weapons production facilities, and of removing from the Korean Peninsula (or otherwise isolating under international oversight) the DPRK’s nuclear weapons and fissile material, is likely to take years, perhaps more than a decade. In the meantime, it is important that the international community be able estimate as accurately as possible the amount of uranium—enriched and natural—that has been produced and used in the DPRK over the decades since its first foray into nuclear technologies, starting in the 1960s or before,2 as well as the amount of plutonium that has been produced in irradiated fuel and separated via reprocessing. Determination and verification of the potential quantity of fissile material existing in DPRK as a result of mining and processing activities in advance of the DPRK’s own declaration of its inventory of fissile materials will require a combination of remote sensing analysis and on-the-ground tests at DPRK uranium mines and other facilities to narrow the range of estimates of historical uranium production, and of the resulting inventory of fissile materials likely to exist in the DPRK.
2 Description of history (or what is known about it) of U mining in the DPRK
2.1 Mining sites: location, extent, dates of known mining
Different researchers and sources offer different opinions on the number of mines from which the DPRK has extracted uranium. It has been reported that uranium has been mined to supply the DPRK’s domestic nuclear industry from more than a dozen mines located in various areas around the country, including Pyongsan, Pakchon, Hongnam, Jusong, Ungki, Sunchon, Cholsan, Kujang, Hamheung, Hekumkang, Wolbisan (possibly same as Wolbingsan, or Kŭmch’ŏn), Hwangsan, Cheonmasan, Wiwon, Musan, and Najin.3 Another source refers to a uranium mine near Hungnam (probably the same as “Hongnam”), where the Japanese built a cyclotron in 1943-44.4
In a report prepared for Nautilus by Edward Yoon,5 two major uranium ore mines in the DPRK: the Pyong-San mine, and the Woong-Gi mine, are described as below.
• “Pyong-San Uranium Mine: This mine is located in Pyong-San–Gun, Hwang-Hae province and has been operating for 30 years under the control of the People’s Army Department. The deposit in this mine area was estimated at 1.5 million tonnes (as Uranium ore), and the mine’s annual production capacity is 10,000 tonnes. The mine has own separator for concentration of ore. All products are sent to the Nyung-Byun (Yongbyon) Nuclear power station under armed guards. Recently, a new facility for Uranium extraction has been built in the Pyong-Won area.
• Woong-gi Uranium Mine: This mine is located in Woong-gi, Ham-Kyung province and has been operating for 35 years under the control of the People’s Army Department. The deposit in this mine area was estimated at 10 million tonnes (as Uranium ore), and its annual production capacity is 19,000 tonnes. The mine has its own separator for concentration of ore. All products are sent to the Nyung-Byun [Yongbyon] Nuclear power station under armed guards. The mine’s operation has been kept secret from outsiders, and even from North Koreans, due to the fact that output from the mine is known to have been used for nuclear weapon development purposes. As a result, the workers and engineers in the mine have been reportedly restricted to the area within the mine facilities even if they suffered from nuclear radiation-related disease.”
2.2 Processing sites and complexes
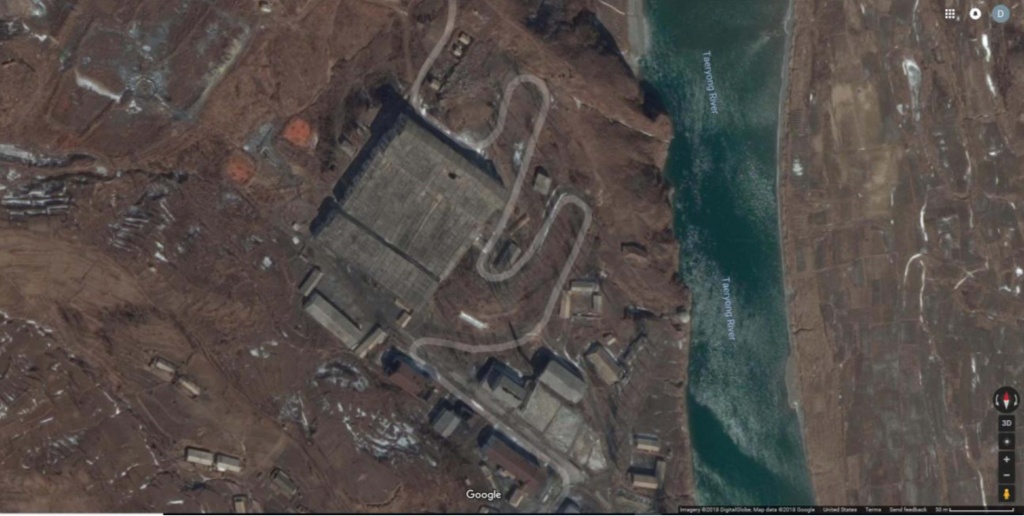
A recent report by 38 North includes references to a uranium concentration plant located alongside the Pyongsan uranium mine (and nearby mines), about 100 km southeast of Pyongyang, as well as another facility, referred to as “the Pakchon Uranium Concentration Pilot Plant”, located in North Pyongan province.6 The Pyongson uranium concentration plant, of which satellite images over time suggest has processed uranium in a number of periods over recent years, is shown in Figure 1. The Nuclear Threat Initiative describes this plant as “having [a]bout 1,500 workers; as of 1999, [and] a capacity to process 200,000 tons of uranium ore into of 290 tons of yellow cake per year”.7 Figure 2 shows an image of the large building (about 100 by 120 meters) located at the latitude/longitude coordinates identified by Jeffrey Lewis in a 2015 38 North publication as those of the Pakchon Uranium Concentration Pilot Plant.8 This location appears to show limited signs of recent activity, though the lighter circles of earth in the upper left of the photo could indicate that structures were recently removed.
Figure 1: Uranium Concentration Plant at Pyongsan, DPRK9
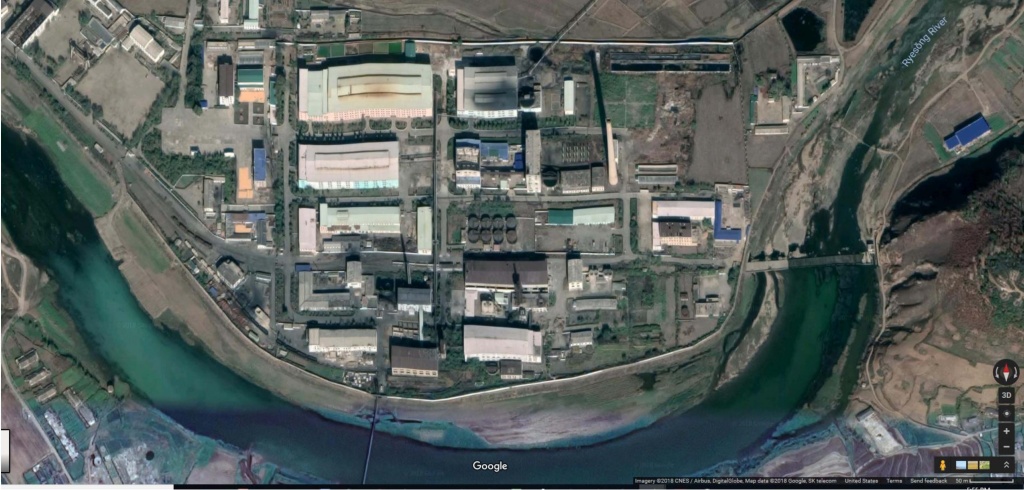
Figure 2: Uranium Concentration Pilot Plant at Pakchon, DPRK10
The Nuclear Threat Initiative (2018, ibid) lists a third uranium processing site, the Cheonmasan Uranium Milling Facility (also listed as a “Suspected Uranium Enrichment Facility”), which it suggests (variously) has 535 or 670 employees. NTI describes the facility as “located underneath Mt. Cheonma”. Joseph Bermudez lists four milling sites, those listed above at Pyongson (the “Namchon Joint Chemical Industrial Company”) and Pakchon (the “April Industrial Enterprise”), one at Sunchon, where other sources have indicated mining has taken place, and one at Kusong used for both mining and milling.11 Bermudez also lists mines at both Sinpo and Unggi, although these may be covered in the list of mines above under different names.
2.3 Ore quantity and quality
Figures on the DPRK’s reserves of uranium and the quality of its ore are difficult to obtain, and their accuracy is unknown.
Two sources suggest that the DPRK’s uranium deposits “are estimated at 26 million tons”12,13. One of the sources describes these deposits as “high grade ore”, so it seems virtually certain that the references are to tonnes of ore, not tonnes of uranium metal (or uranium oxides). Another source states:
“It has been estimated that, at its peak in the early 1990s, North Korea was able to produce about 300 tonnes of yellow cake [U3O8] annually, equal to approximately 30,000 tonnes of uranium ore.”14
The information from this source implies that the DPRK’s uranium ore has (or had) an average U content of about 0.9 percent, which is quite high—most uranium ore in the Northeast Asia region has an average U content of closer to 0.2 percent or less15—so this estimate may be in error. Other analysts of the subject have reported estimates of 3 and 4 million tonnes of “reasonably assured resources”, based on older OECD and ROK estimates, respectively. Still another source cites a figure of 4.5 million tonnes of uranium ore, and quotes “Russian scientists who have visited North Korea” as saying that the DPRK’s “mining and milling capabilities produce 2000 tons of natural uranium, per year”.16 A 2004 Nautilus report described DPRK deposits as “uraniferous black shale occurrences (perhaps similar to that at Ok´chon in South Korea) occurring at a depth about 200 meters. The ore grades are about 0.2%”.17
The Nuclear Threat Initiative lists the uranium ore extracted from the “Kŭmch’ŏn Uranium Mine” as being reported by a defector as having “a uranium content of 0.8 percent, a vanadium content of 1.4%, and other rare metals such as nickel, molybdenum and radium”. The same uranium content is listed by NTI for the Pyongsan mine, although the figures in the quote above from the NTI reference, 290 tons yellowcake from 200,000 tonnes ore, would seem to imply a U content of more like 0.2 percent, assuming about 20 percent losses in processing. The Nuclear Threat Initiative lists the Hamhung Uranium Deposit as having “approximately 4 million tons of uranium deposits”. In his 2015 (ibid) 38 North article on NK U mining and milling facilities, Jeffrey Lewis includes a 1979 quote from a telegram from the Hungarian ambassador to the DPRK, in turn quoting a Soviet source, and giving the average ore quality at the two main NK U mines at the time as “0.26 percent, while in the other it is 0.086 percent”.18 Lewis goes on to say “[b]ased on other information released by the Soviet Union, it appears these mines are near Pakchon and Pyongsan, with Pyongsan likely having the higher quality ore.” These values are considerably lower than the 0.8 to 0.9 percent estimates described above, but closer to international averages.
Reports on a pair of missions (1987 and 1990) undertaken by International Atomic Energy Agency (IAEA) experts at the request of the DPRK government,19 indicate that at the time DPRK engineers were working with fairly rudimentary uranium prospecting equipment, often of Russian origin and decades old, although DPRK government news releases in the last few years have praised progress in uranium processing technology.20
2.4 Trade in uranium and related ores with other nations (Russia, China)
The DPRK is reported to have exported significant amounts of uranium ore over the years, starting in (at least) the 1947-1950 period, with the export of “over 9,000 tons of uranium [presumably ore] and an unknown amount of monazite to the USSR”, and continuing with a reported “$6 billion worth of uranium ore” to the USSR in 1985, “1,500 tons of monazite21 annually” in the 1990s to “China, Japan, Spain, and Hong Kong”22. More recently, an advertisement by the DPRK’s International Chemical Joint Venture Corporation was published in an English-language DPRK trade journal in 2001 and 2002 advertised ammonium diuranate (ADU), a processed form of yellowcake (U3O8), for sale on the international market23. A report in late 2006 that the DPRK and Russia had been negotiating, apparently since 2002, a deal that would give Russia “exclusive rights” to the DPRK’s uranium deposits “in exchange for Moscow’s support at six-party talks aimed at denuclearizing Pyongyang” suggested that Russia would enrich DPRK uranium for re-export to Vietnam and China as nuclear fuel. The report was dismissed as “rumors” by Russian authorities24.
Exports from the DPRK to China of 90.54 and 34.9 tonnes of “Thorium Ore and Concentrate” were listed in China Customs statistics (and the United Nations Comtrade database) for the years 2004 and 2007, respectively. The listed values for these shipments, about $22,000 and $7,400 USD, suggests that the exports were of ore, not refined metal, or yellowcake, which would have been 200 to 1000 times as costly. Uranium and thorium exports from the DPRK to China are not listed for other years between 1996 and 2017, but trades with China in the same category (thorium) with a total value of about $95,000 were listed in 1994 and 1995.25 No quantities are listed for the latter trades, but assuming thorium ore at costs per tonne similar to the trades in 2004 and 2007, the 1994 and 1995 trades would total about 400 tonnes of ore. Note that this review of Comtrade data certainly does not rule out other, off-the-books trades in uranium and/or related ores between the DPRK and other parties.
2.5 Existing estimates of total uranium production as prepared by others
We have thus far been unable to identify existing estimates of the cumulative production to date of uranium in the DPRK, either as refined yellowcake or as mined ore. This is likely because most analysts have focused on the estimation of the DPRK’s cumulative production and inventories of fissile material, namely highly enriched uranium and plutonium (see below). Inventories of these fissile materials imply minimum historical production levels of uranium ore and of the refining of ore into uranium oxide and/or metal, but cannot encompass uranium or ore that might be in storage, and available for processing into feed for enrichment facilities or reactors.
3 Major uncertainties in preparing estimates of historical DPRK uranium production
Barring past or future imports of uranium or plutonium, the total uranium production over time (meaning since the beginning of significant mining) in the DPRK serves to set an upper limit on the DPRK’s potential production of nuclear materials for weapons. Calculating cumulative DPRK uranium production, however, requires the knowledge of a number of factors, many of which, as indicated above, are uncertain. The key uncertainties involved are summarized below.
3.1 Volume of ore removed
Once a uranium ore deposit has been identified and mine development has taken place, the quantity of ore produced by the mine is a determinant (but not the only one) of the amount of uranium extracted. In the case of the DPRK, as indicated above, there are uncertainties as to how many mining sites have seen significant production, what the capacity of many of the sites are (although we have some estimates for major mines), and how much, on average, the mines have operated relative to capacity (average capacity factor) over the years. All of these factors are required for an accurate total estimate of the volume of ore removed, and thus should be the focus of various on-the-ground and remote methods of reducing uncertainty.
3.2 Ore quality
As noted above, there are a wide range of reported ore quality (fraction of uranium per unit weight of ore) in the DPRK. If the average is indeed closer to 0.8 to 0.9 percent, as opposed to 0.2 percent or lower, the amount of uranium mined when a given volume of ore is removed could be a factor of four or more higher. As such, obtaining a better understanding of the ore quality in the DPRK, probably through sampling of ore bodies, mined ore samples, and/or ore processing wastes, is likely to be required to reduce this uncertainty.
3.3 Uranium remaining in wastes after processing
Also uncertain is what fraction of the uranium in the ore mined in the DPRK remains in the product yellowcake. Uranium ore can be processed in a number of different ways, with the choice of technology depending on factors including the concentration of uranium minerals in the ore, the composition of the other minerals in the ore, and, of course, the technologies and other inputs (such as chemicals for processing) available. Different processing approaches, and the way that processes are operated, yield different levels of uranium losses, that is, different amounts of uranium end up in tailings and other wastes, as opposed to the product yellowcake. Uranium losses during processing can range from 10 to 30 percent,26 and reducing the uncertainty as to the loss rate is helpful in identifying, how much ore has been processed and how much concentrated uranium has been produced, particularly if measurements of the uranium content of tailings and other wastes are an input to the determination.
3.4 Unreported exports to other nations
Also unknown is how much of the DPRK’s uranium, whether as ore, yellowcake, or uranium hexafluoride (UF6) might have been exported. It has been reported that the DPRK shipped 1.6 tons of (UF6) to Pakistan, which was later shipped on to Libya,27 and likely provided at least technology for the Syrian plutonium production reactor destroyed by Israel in 2007, though whether the DPRK provided uranium for that reactor is not clear. Various analysts suggest that these known instances of nuclear cooperation with other nations are only a part of the DPRK’s trade in nuclear technologies. As such, unreported trades of uranium, beyond the few recorded “on books” trades and the several sales of ore to Russia, China and others, as described above, would affect the possible inventories of fissile material that remain in the DPRK
3.5 Uncertainties as to whether DPRK has uranium in storage
The DPRK may have uranium in storage as ore, or, more likely, as yellowcake or other forms of uranium concentrates, which requires a much smaller storage volume, and is easily concealed. To the extent that these stores exist, they could complicate efforts to understand the DPRK’s holdings of uranium. Although uranium in storage would presumably be accounted for if an accurate understanding of ore produced and processed could be obtained, in practice it is likely that the uncertainties in ore volumes produced and processes will accommodate a large range of potential volumes of concentrated uranium in storage.
4 Techniques and tests to try to narrow uncertainties
Given that the uncertainties identified above are multiplied with each other when one attempts to use data from the uranium production and use chain to help calculate the uranium that the DPRK (or another nation) has on hand, it is desirable to reduce uncertainties as much as possible at each level. Some of the methods for doing so are discussed below. Some uncertainty reduction methods can be undertaken through the use of satellite images, but others will require access to uranium-related sites.
4.1 Satellite imagery measurements of ore slag piles, and other features near mines and mills
In a recent summary of satellite and other remote methods of assessing uranium mining and milling, Jeffrey Lewis and co-authors include the use of changes of geographical features seen in series of satellite images over time, using Synthetic Aperture Radar (SAR) to look at small changes in elevation over time, and in some cases to see inside structure, and using “hyperspectral imagery” to possibly identify specific minerals.28
• Mining activity, and in particular underground mining, typically results in the accretion of piles of spoil—the rock in which ore is found—in the vicinity of the mine. Satellite images of an area over time can be used to identify areas where mining is active, and, in some cases, estimate the volume of material removed, though sometimes such estimation is complicated by complex terrain and other factors. Additionally, uranium milling releases tailings, the minerals remaining as waste after uranium (and in some cases, other valuable metals, such as vanadium) are removed. These tailings may end up in piles or ponds near the mill, and can be tracked from space. Lewis used these techniques in a 2015 paper looking at recent DPRK uranium mining and milling activity.29 Others at the Center for Nonproliferation Studies have used these techniques to estimate the capacity of the DPRK’s Pyongsan uranium milling facility, obtaining estimates of between 273 and 885 tonnes of uranium per year, depending on assumptions about ore grade and on the number of counter current decantation units assumed to be contained in buildings (and therefore not visible in images) at the Pyongsan site.30 An extension of human analysis of satellite images is to use detection algorithms to screen series of images for changes indicative of mining activity. To use detection algorithms, a researcher would identify a physical area of interest within a satellite image, then use one (or hybrids) of a range of techniques to analyze the digital data in the satellite image to detect changes in that area over a temporal series of images. Some of the analytical techniques that can be employed to look for differences occurring in an area over time include image differencing, ratio of means, change vector analysis, inner product and spectral correlation analysis, and multi-variate correlation detection.31
• Synthetic Aperture Radar is capable of imaging areas with resolution to the tens of centimeters, and is sometimes capable of seeing through thin roofing material to detect and size equipment within buildings. It can also be used to detect changes in piles of material, such as mine spoils or tailings, or change in roads or other infrastructure.
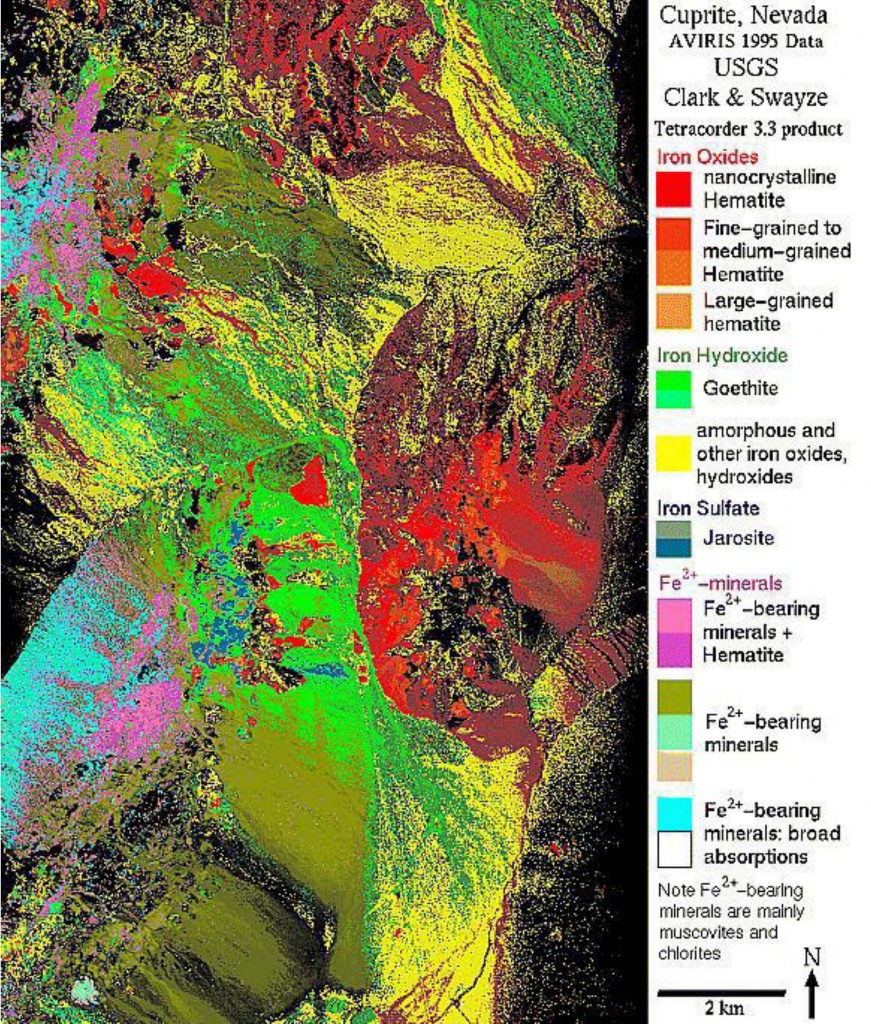
• Hyperspectral sensor capture light reflecting from objects over a wide range of spectra, in both the visible and non-visible ranges. Hyperspectral images, together with processing software, can be used to look at “dozens or hundreds” of spectral bands, and thus to discern between different types of ground cover and minerals. A recent review of the use of hyperspectral remote sensing for mineral exploration includes the following description:32 “Hyperspectral remote sensing combines two sensing modalities: imaging and spectroscopy. An imaging system captures a picture of a remote scene related to the spatial distribution of the power of reflected and/or emitted electromagnetic radiation integrated over some spectral band… [at the same time] spectroscopy measures the variation in power with the wavelength or frequency of light, capturing information related to the chemical composition of the materials measured. The instrumentation used to capture such spectral information is called an imaging spectrometer or a hyperspectral sensor…”. The spectral information from surface features is compared with the known spectral properties of minerals—for example, uranium or the minerals in which uranium is found in or with—and the spatial distribution of the minerals of interest are mapped through the analysis of the acquired hyperspectral data. An example of a hyperspectral image processed for minerals detection is provided in Figure 3. analysis has been used to evaluate uranium deposits in Australia on a test basis.33 Case studies of the large Ranger uranium mine matched spectra of known minerals with those found in hyperspectral images of known mines, and a case study of uranium/rare earth element deposits in Queensland used techniques such as Spectral Angle Mapper, Mixture Tuned Matched Filtering. Additional details on these investigations can be found in the source references. At present, the drawback of this technology is that adequate hyperspectral coverage is not currently available by satellite, as NASA’s Hyperion orbital sensor, the most readily available source for such data, functioned from 2000-2017. New images thus require flyovers by planes or drones fitted with suitable detectors, which is only possible in some circumstances (not, currently, in the DPRK). A technical issue is moving the large amounts of spectral data from space to earth-based receivers. Several ventures, are working on the data transfer problem for a variety of potential applications of hyperspectral data.
All three of these approaches—evaluation of conventional satellite images, of SAR data, and of hyperspectral data—can be combined with machine learning (including “deep convolutional neural networks”) and ground truthing at known facilities to develop and refine algorithms that allow computers to process image data to identify potential sites and changes in sites over time. Research in this area is ongoing. In addition, satellite imagery can be used to preliminarily identify sites that should be visited on the ground to confirm or rule out the presence of uranium-related activities such as mining or refining (and possibly enrichment. For those sites determined to be related to uranium fuel cycle activities, satellite imagery can be used to help guide direct physical measurements, for example of mine spoil piles or of tailing dumps from uranium refining, as well as sampling, for example, of uranium contents and for concentrations of related decay-chain isotopes. Satellite imagery can also be used to help identify places that should be asked about in interviews of DPRK scientists, and about which information should be sought in documentation provided by DPRK officials as part of a denuclearization agreement.
Figure 3: Example of Hyperspectral Image Processing for Minerals Detection34
4.2 Satellite imagery measurements of uranium mills
In a 2015 study, three Indian authors researched methods of using satellite images to identify the capacity of known uranium mills.35 Measuring the diameter of the Counter Current Decantation (CCD) units that are common to uranium mills (these are also sometimes called thickeners in common parlance) from satellite images of mills around the world where the mill capacity was fairly well known, these authors developed a “methodology for estimation of an appropriate production function”. The methodology estimates annual mill production capacity as a function of ore grade (effectively, % U in ore), the number of CCD units present, and the area of CCD units. CCD units are among the common features of a uranium mill, and are among the features most likely to be visible from space. They then used the methodology to check the individual prediction for the throughput capacity of the known mills sites included in their database, and to estimate the capacity of a known uranium mill in Pakistan. The authors note that the accuracy of their methods depend greatly on having accurate data on the actual quality of ore used both in the mills that form their database and in the mills to which the methodology is applied. They also note that an estimate of the capacity of a mill is only one input to understanding its output, as the mill may not operate at full capacity.
A first step to applying the type of methodology these authors developed is to identify a site as definitively being a uranium mill, as opposed to a mill used to process some other mineral, such as copper. Mineral processing mills designed to concentrate different metals often use equipment that, at least from space, looks similar. In a separate paper, the same three authors described means of determining whether minerals refining mills are or are not uranium mills, based in part on, for example, the presence of equipment, such as smelters, that would not typically be a part of uranium milling facility, and of equipment that would be present at a uranium facility but not elsewhere.36
4.3 On-site measurements of ore slag piles near mines
Measurements of ore slag piles located near mines can help to identify the volume of material removed from the mine, including both overburden/slag and ore, which can in turn, along with information about ore uranium content, help to determine the amount of ore removed. The use of core sampling techniques can be used to indicate the variation in ore content of slag over the period in which the slag was deposited, providing indications of how the ore quality in the deposit may have varied over time. In addition, there are many potential DPRK uranium mines where little if anything is known about the production capacity, history of production, or indeed whether the mine has ever operated. Site visits and on-site measurements at these locations will help to reduce the spread of uncertainty as to overall DPRK ore production capacity and output.
4.4 On-site evaluation of mines to estimate fraction of U-bearing ore expected to be extracted versus overburden
Expert evaluation of the structure of a mine itself can provide information about the expected ratio between ore and overburden that would have been (or is being) extracted, and can be used together with on-site measurements of slag piles to help to estimate the amount of ore taken from a mine over time.
4.5 Isotopic examination of ore slag piles
Isotopic examination of samples from ore slag piles for long-lived uranium decay products such as protactinium-231, thorium-232, and radium-230 could provide clues as to the concentration of uranium in the original ore.
4.6 Evaluation of uranium content of ore samples by mine
Evaluation of the uranium content of ore samples by mine can help to determine at least the current average uranium content of ore being extracted, and in combination with information about mine output (tonnes of ore), can help to indicate the amount of uranium being produced in a given year. To the extent that older ore samples that are both dated and representative of average ore mined can be tested, additional information about the history of mine output may be available. It is possible that testing ore present in older, no longer mined, sections of a mine can also help to determine the history of uranium production at a given location.37
4.7 Evaluation of uranium content and isotopic composition of waste ponds from uranium ore processing to yellowcake
When ore is processed to remove and concentrate uranium the resulting uranium-depleted slurry is typically dumped in waste ponds.38 Measuring the volume of these “tailings” can help to establish the volume of ore processed over time in a given mill. Samples, including core samples, are taken from tailings, and evaluating those samples for uranium content, which would typically be related to the concentration of uranium in the ore, depending on the way that the process is/has been operated, may provide clues as to the original concentration of uranium in the incoming ore. Core samples of tailings piles and waste pond sediments provide a way of going “back in time”, as the samples farther down in the core represent material deposited earlier in the life of the uranium processing facility. Slices of a given core sample are tested for content of uranium, and the resulting concentrations are evaluated based on where in the core a given sample is taken. In addition, using techniques such as gamma and alpha spectrometry can help to determine the relative concentration of uranium isotopes and other radionuclides within sediments in waste ponds, which can help to determine when the ore was processed and its original U concentration, as well as which mines the ore came from.39 In this way, isotopic examination of tailings samples for long-lived uranium decay products should also provide clues as to the concentration of uranium in the original ore. Other types of analyses, including raman spectroscopy, can track minerals associated with uranium in ores, and thus also help to determine which mines or ore bodies the uranium processed at the facility originally came from (see below).
4.8 Establishing Nuclear Forensic Signatures for mines
The uranium ore and uranium concentrate produced from a given mine has characteristic non-uranium impurities and isotopic composition that can be traced from mine to yellowcake, and thus help to determine the origin of uranium used in the nuclear fuel cycle, and by extension, help to determine the output of a given mine. Examples of the types of measurements that can be made of ore and uranium concentrate include measurement of the abundance of rare earth minerals as a reflection of the geochemical conditions in the mine, other trace element measurements of the impurities in processed uranium and in mines, and measurements of uranium/lead (Pb) and lead/lead isotope ratios, both as an indicator of mine identity and to date the uranium deposit, itself also an indicator of mine identity.40
4.9 Information for confirmation of past U ore imports by trade partners
As noted above, only a very few trades of ores containing uranium and thorium appear in at least aggregate trade statistics in recent years. Piecing together more of a history of the DPRK’s trade in uranium ores (and/or metals) will therefore depend first on a thorough search of literature including, for example, available historical Soviet and Eastern Bloc diplomatic communications, as well as detailed trade statistics showing firms involved, quantities, values, and related information from, for example, Russia, China, and other nations thought to be or have been importers of DPRK ore. Next might come requests to possible importer nations for information on historical trades with the DPRK, although one imagines that in perhaps the majority of cases, such information will not be forthcoming. Finally, information on past exports could be sought from the DPRK itself as a part of a denuclearization deal. Requests for information on uranium exports should be accompanied by requests for information from at least the DPRK, and possibly other nations, on imports of uranium by the DPRK, though we assume that such trades, apart from, for example, imports of enriched uranium in small quantities from Russia for the DPRK’s small research reactor at Yongbyon, are unlikely to have taken place in significant volume
5 Estimates of enriched uranium produced
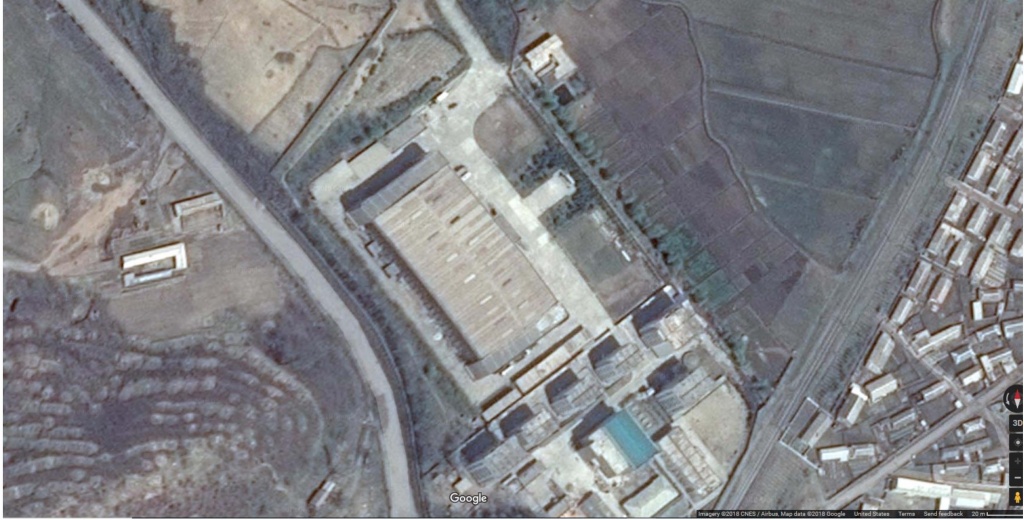
Uranium used in nuclear weapons is enriched from natural levels (about 0.7% U235) to about 90 percent U235, referred to as highly enriched uranium, or HEU. For the last several decades, the primary enrichment technology employed has been to use large arrays of gas centrifuges that separate uranium isotopes fed into the centrifuge system as uranium hexafluoride gas. Although the international community had long suspected that the DPRK had a clandestine uranium enrichment program, or at least was pursuing research into enrichment technologies and application, the first concrete proof of the DPRK enrichment program came in 2010 when Professor Siegfried Hecker was shown the centrifuge hall at the Yongbyon Nuclear Complex by his North Korean hosts. Since then, analysts have suspected that the DPRK may have, or may have been developing, at least one other uranium enrichment facility, and possibly two. Another large facility, estimated to be larger than the enrichment plant at Yongbyon, has been tentatively identified at a site called Kangsong, in the town of Chollima, on the outskirts of Pyongyang.41 Although the team that identified the Kangsong site, led by Professor Jeffrey Lewis, stops short of definitively identifying it as a centrifuge plant, Lewis was quoted as saying “this [the Kangsong building] is a suitable building that has a number of signatures consistent with that [being an enrichment plant] and no obvious inconsistencies”, and that it is “clearly a sensitive national defense site.” Figure 4 shows a Google Earth image of the plant. The large building in the middle of the image, measuring roughly 50 m by 100 m, is the possible enrichment hall.
The estimated number and size of the centrifuge cascades within the Yongbyon facility, the possible Kangsong facility, and a possible third enrichment plant is a major uncertainty in all of the estimates of the DPRK’s enriched uranium inventory summarized below.
Figure 4: Possible Uranium Enrichment Facility at Kangsong, near Chollima, DPRK42
• Hecker, Braun, and Lawrence (2016) estimated that the DPRK had a stockpile of 300 to 450 kg of HEU by 2016, and was producing additional HEU at a rate of 150 kg/yr.43 Key assumptions (and thus uncertainties) in this estimate are that the estimate is based in part on an assessment of the availability of key, possibly limiting components and materials that the centrifuge program would require, and that total centrifuge capacity was 35,000 kg SWU (separative work units) per year, or the output of about 8750 P-2 type centrifuges. Implied in this estimate is a “tails assay” (fraction of U235 in the depleted uranium gas exiting the centrifuge cascade) of about 0.2%, and an annual input feed of natural uranium of about 27 tonnes of uranium.44 Use of a higher value for the tails assay implies greater production of HEU, and greater natural uranium requirements. For example, raising the tails assay to 0.5% means that about 230 kg/yr HEU can be produced, with an input feed rate of about 100 tonnes of natural uranium per year.
• David Albright of the Institute for Science and International Security (ISIS) estimates that the DPRK HEU stocks as of the end of 2017 were between 230 and 760 kg, “where 230 kilograms corresponds to a median estimate for the case of one centrifuge plant and 760 kilograms corresponds to the median estimate for the case of two centrifuge plants”.45 Here the major uncertainty seems to be the existence of the second centrifuge plant, as well as how long it has been operating (and at what capacity factor).
• Signs that the Experimental Light Water Reactor (ELWR) built at Yongbyon may have started up or be in a testing mode as of 201846 imply that the DPRK has produced at least enough low-enriched uranium (LEU) for one fueling of that unit (thought to be 4 tonnes of LEU), if not more.47
The estimates above yield a possible overall range on the order of 300 to 900 kg of HEU stocks produced by the DPRK (including HEU used in weapons tests) by late 2018. At these levels, the DPRK’s estimated HEU stocks represent about 60 to 400 tonnes of natural uranium, assuming 5 percent losses in converting yellowcake to UF6,48 and similar losses in converting enriched UF6 to HEU metal, and using a range of enrichment tails assays from 0.25% to 0.5% U235. These values, in turn, assuming a range of ore uranium contents of 0.2 to 0.9 percent (see above), and losses of about 20 percent in ore processing and uranium conversion to yellowcake, imply uranium ore requirements of about 9,000 to 300,000 tonnes. If an additional 4 tonnes of LEU has been produced to fuel the ELWR, an additional 30 to 60 tonnes of natural uranium would have been required, which translates to about 4,000 to 40,000 tonnes of ore.
6 Estimates of plutonium (Pu) produced
The DPRK has produced plutonium in its (nominally) 5 megawatt electric (equivalent) reactor (5 MWe) at the Yongbyon nuclear complex starting in approximately 1989, and continuing, with several interruptions, to the present day. The 5 MWe reactor uses fuel made of natural uranium (0.7% U235) in its graphite-moderated core. A number of authors have prepared or cited estimates of total plutonium production over time, including the following:
• Hecker et al (2016, ibid) estimated Pu production by the DPRK of 42 to 63 kg by 2016, less 10 percent losses in reprocessing. This estimate includes Pu used in nuclear weapons tests (see below). Key uncertainties in these estimates, as described by the authors, include the average power levels in the plutonium production reactors, the efficiency of reprocessing, and the amount of Pu in the waste streams from reprocessing. With the 5 MWe reactor capable of producing an additional 6 kg of Pu annually, these estimates would presumably be in the 54 kg to 75 kg range by 2018.
• Albright (2018, ibid) provides an estimate of 30 kg of separated Pu by the end of 2017.49
• An assessment that the DPRK possessed about 50 kilograms of Pu was published by the Korea Times in 2017, citing a 2016 ROK Defense White Paper.50
The estimates above, ranging from about 36 to about 75 kg of Pu production by late 2018, can be used to calculate implied input uranium requirements for the Yongbyon graphite-moderated plutonium production reactor (5 MWe). Assuming plutonium conversion in spent fuel from that reactor at about 0.6 kg/t U,51 the DPRK’s estimated plutonium stocks represent about 70 to 140 tonnes of natural uranium, assuming 10 percent losses in fuel fabrication. These values, in turn, assuming a range of ore uranium contents of 0.2 to 0.9 percent (see above), and losses of about 30 percent in ore processing and uranium conversion to uranium metal, imply uranium ore requirements of about 10,000 to 100,000 tonnes.
7 Estimates of uranium and plutonium used in DPRK weapons tests
Some of the production of Pu and HEU described above has been used by the DPRK in its six nuclear weapons tests to date (through late 2018). Estimates of the amount of fissile material used in those tests include the following:
• Hecker et al (2016, ibid) assume that three of the first five tests undertaken by the DPRK used Pu, and that on the order of 15 kg of Pu was used in those tests, plus an approximate 10 percent “production losses in plutonium purification and metal fabrication”. Hecker et al note that the amount of Pu used during these tests is hard to determine due to lack of knowledge about the designs of the explosive devices tested, and how much Pu was used in each device.
• Jeffrey Lewis, quoting, respectively, a DPRK defector and DPRK state sources, suggests that the first nuclear weapons test carried out by the DPRK, which was judged to have failed by the international community, used only 4 or 2 kg of Pu.52 Lewis suggests that the DPRK has purposely pursued smaller bomb designs as to learn more from their tests, and thus save fissile material.
• David Albright offers a “median estimate” of 7 kg of Pu used in the two weapons tests in 2006.
• We have yet to find direct estimates of the amount of HEU used in the (assumedly) three, or perhaps four, tests where HEU was likely to have been used, but if we use the range suggested by Albright (2017, ibid), of 15 to 25 kg HEU per detonation, we get a range of about 45 to 100 kg HEU used in the tests.
The above imply that perhaps 7 to 15 kg of Pu were consumed in the DPRK’s nuclear tests, along with about 45 to 100 kg of HEU. These estimates lie in the range of about 5 to 20 percent of the DPRK’s estimated fissile material production, as described above.
8 Quantitative demonstration of impact of narrowing uncertainties in uranium production on estimate of overall current DPRK processed uranium and fissile material inventories
An exhaustive estimate of the total uranium produced by the DPRK, and thus of an upper bound on the amount of fissile material available to the DPRK (assuming no or insignificant imports of same) would in theory require determined values or estimates for a number of different parameters. These parameters would include:
• The average capacity of DPRK uranium mines, ideally by historical period
• The average capacity factor of DPRK uranium mines, also by historical period
• The capacity of uranium mills, and/or the fraction of uranium ore milled to produce natural uranium
• The fraction of uranium ore (or other forms of uranium) exported to other nations, also ideally by historical period
• The average fraction of uranium in uranium ore (which may have changed over the history of DPRK uranium production)
• The efficiency with which uranium mills convert uranium to yellowcake (U3O8)
Estimates of the amount of fissile materials produced from the DPRK’s uranium output would further require:
• Estimates of the efficiency of conversion of uranium in yellowcake to uranium hexafluoride and back to uranium oxide for reactor fuel
• Estimates of the fraction of purified forms of natural uranium (UF6, UO3, uranium metal) retained in storage, versus the fraction undergoing enrichment or conversion to natural uranium reactor fuel (for example, for use in Yongbyon “5 MWe” reactor)
• Estimates of the fraction of uranium remaining in uranium “tails” (depleted uranium) from enrichment to HEU and LEU
• Estimates of the fraction of Pu in reprocessed fuel prior to reprocessing
• Estimates of the efficiency of Pu recovery during reprocessing
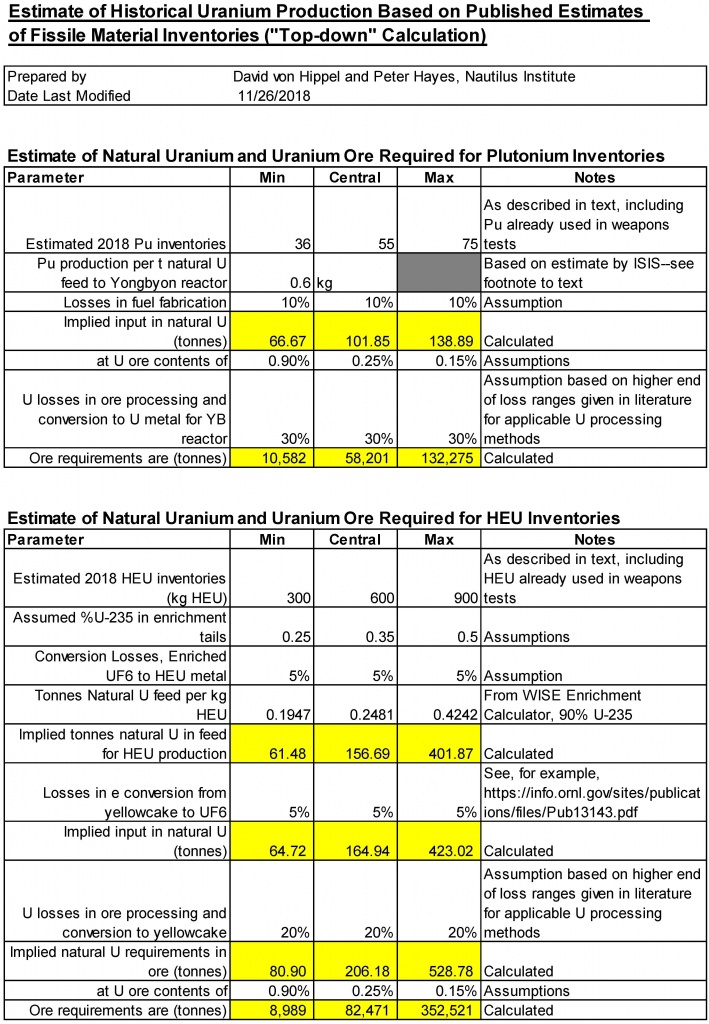
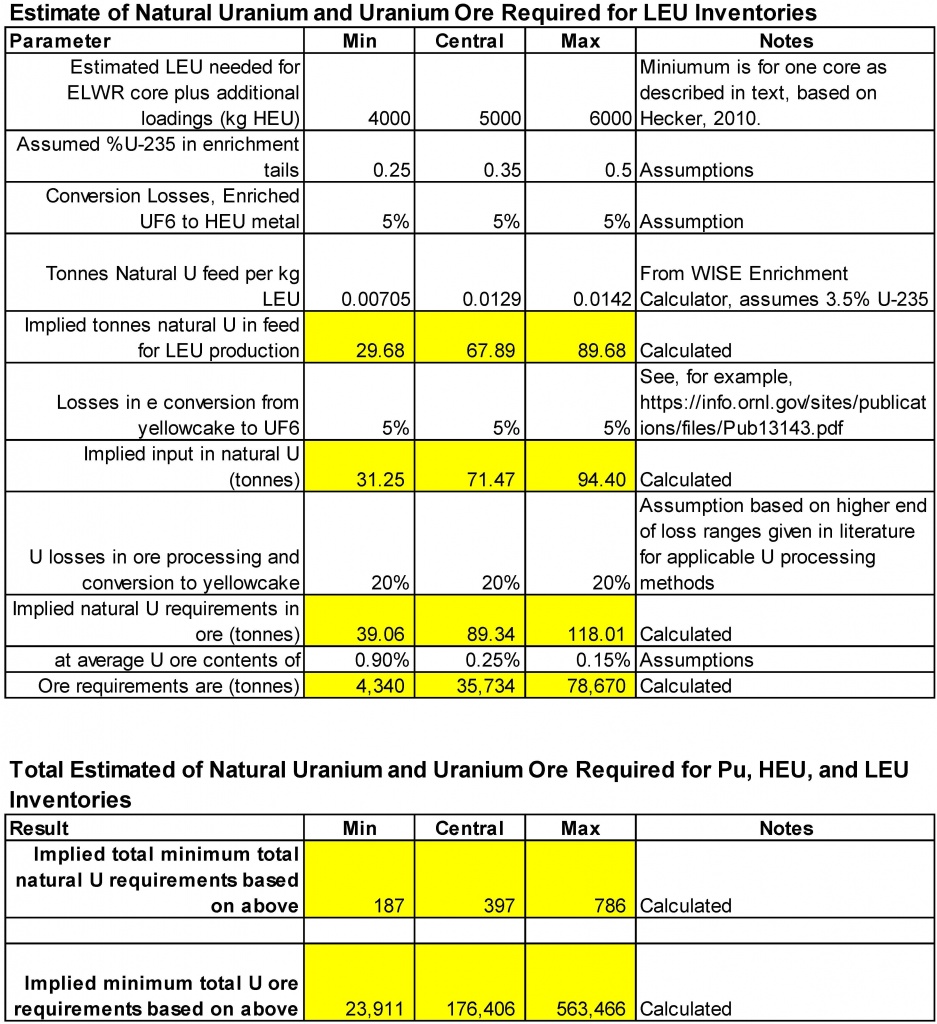
We have undertaken what must be considered initial estimates of the amount of uranium that may have been mined and milled over time in the DPRK using two different procedures. The first, which might be called “top-down” starts with the estimates of the amount of fissile materials thought by others (as described above) to be held by the DPRK and/or have been used in weapons tests, and calculates the volumes of uranium and uranium ore implied to have been produced. The second approach starts with estimates of the DPRK uranium mining capacity and estimates overall uranium ore and refined uranium production. Comparison of the differences between the two estimates, including sensitivity analysis with the second approach, is used to try and determine what types of information should be sought, either on the ground or by remote means, to try and narrow down the estimates of uranium available to the DPRK as a part of nuclear weapons/nuclear materials verification in support of a denuclearization agreement. Below, and in the annexes that follow, we present the methods and results of our estimates.
8.1 Presentation of central estimate and range of estimates at present
“Top-down” Estimates of Uranium and Uranium Ore Produced by the DPRK
Starting with the ranges of estimates of enriched uranium and plutonium production prepared by others, and summarized above, and selecting “central” estimates from those ranges, we estimate that on the order of 200 to 800 tonnes of natural uranium (as U, not uranium oxides) would be required to produce the ranges of enriched uranium—as HEU for weapons (or possibly some for the Yongbyon research reactor) and as LEU for the DPRK’s ELWR—and plutonium described above. A central estimate is 400 tonnes uranium. These calculations are shown in Annex 1. Please note that in both Annex 1 and 2, although results are shown for convenience to many digits, the figures shown should probably not be considered accurate to more than one significant figure.
Using a range of average uranium concentrations in DPRK ore of 0.15 percent to 0.9 percent, with a central estimate of 0.25 percent, we get uranium ore requirements implied by the production estimates above ranging from about 20 thousand to 600 thousand tonnes, with a central estimate of somewhat under 200,000 tonnes.
Note that these are cumulative, not annual figures. Note also that these figures do not include any estimates of the amount of uranium in processed or ore form that the DPRK may have in storage. We would consider the possibility of significant amounts of ore being held in storage less likely than storage of processed uranium, as to the bulk of ore that would have to be stored would be on the order of one hundred to (more likely) over one thousand times the volume of processed yellowcake with the same uranium content.
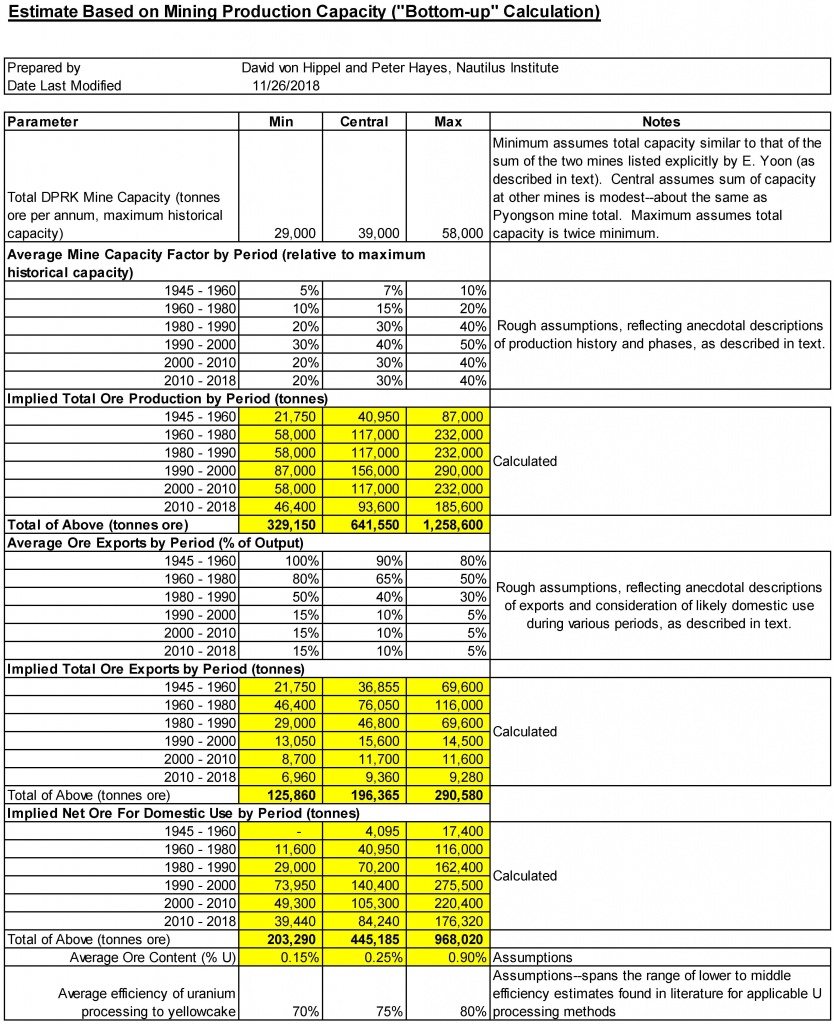
“Bottom-up” Estimates of Uranium and Uranium Ore Produced by the DPRK
Starting with estimates of DPRK uranium mining capacity, and implicitly assuming that most, if not all, mined uranium is processed to yellowcake (and that therefore the processing capacity is sufficient to more or less keep up with ore production), we estimate that between about 200 and 7,000 tonnes of natural uranium (tonnes U) has been produced by the DPRK, with a central estimate of about 800 tonnes U. Note that this estimate excludes uranium that may have been exported (mostly as ore, but possibly in small part in refined form) and thus remains in the country in some form—as yellowcake or other uranium oxides, uranium metal, UF6, HEU, LEU, depleted uranium or as Pu produced from uranium.
The lower end of this estimate starts with mine capacity of 29,000 tonnes of ore per year, which is the sum of the estimates for two major mines described by Yoon (ibid). The higher end of the estimate is capacity doubles that estimate, and a central value was chosen as 38,000 tonnes/yr, which assumes that the other mines (that is, apart from Pyongsan and Woong-gi) that have been noted in various articles sum to a capacity of about 10,000 tonnes of ore annually. Using the same range of ore concentrations—from 0,15% U to 0.9% uranium—implies total cumulative uranium ore output (net of exports) of about 200,000 to 1 million tonnes of ore, with a central estimate of about 400,000 tonnes. See Annex 2 for details of these calculations.
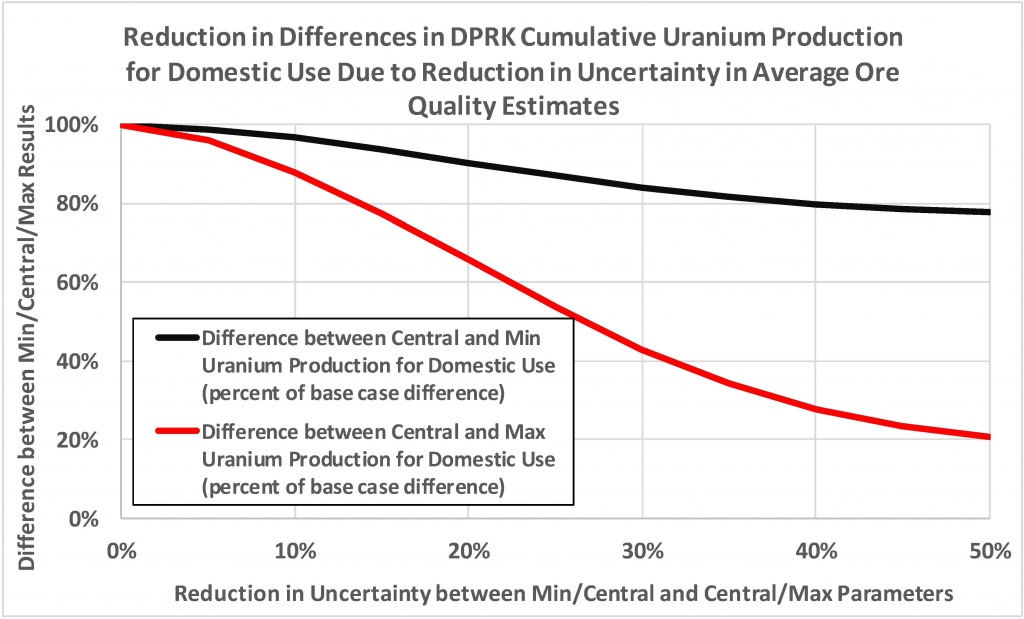
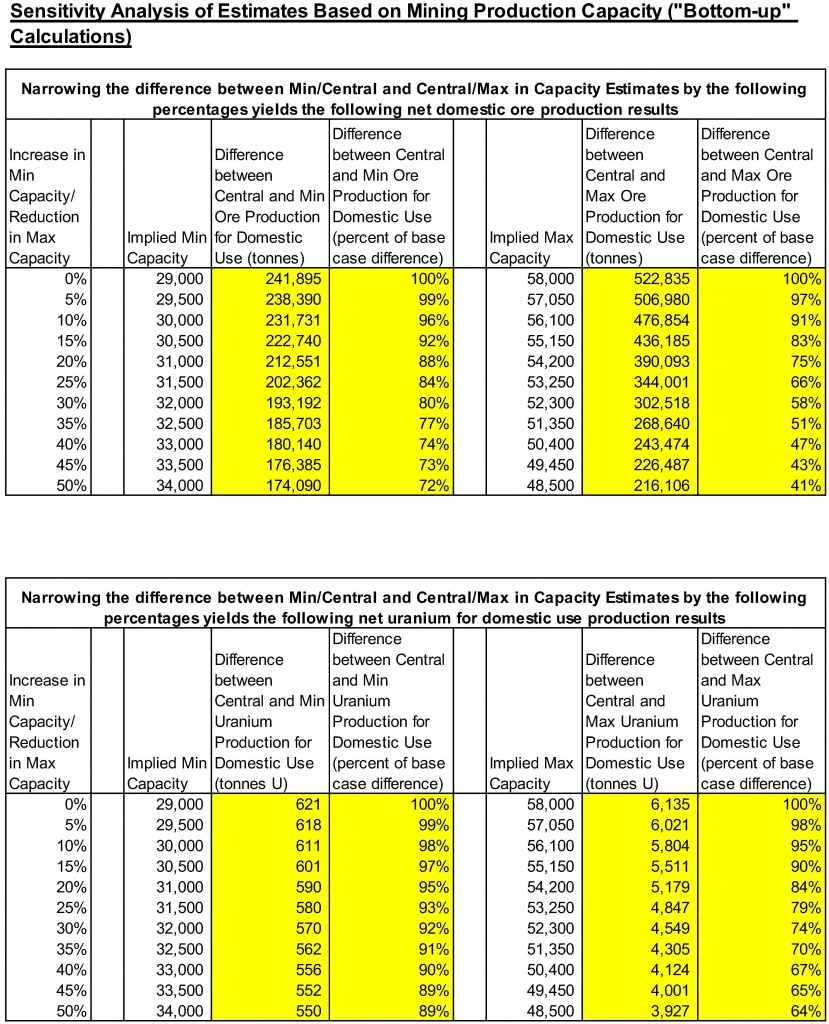
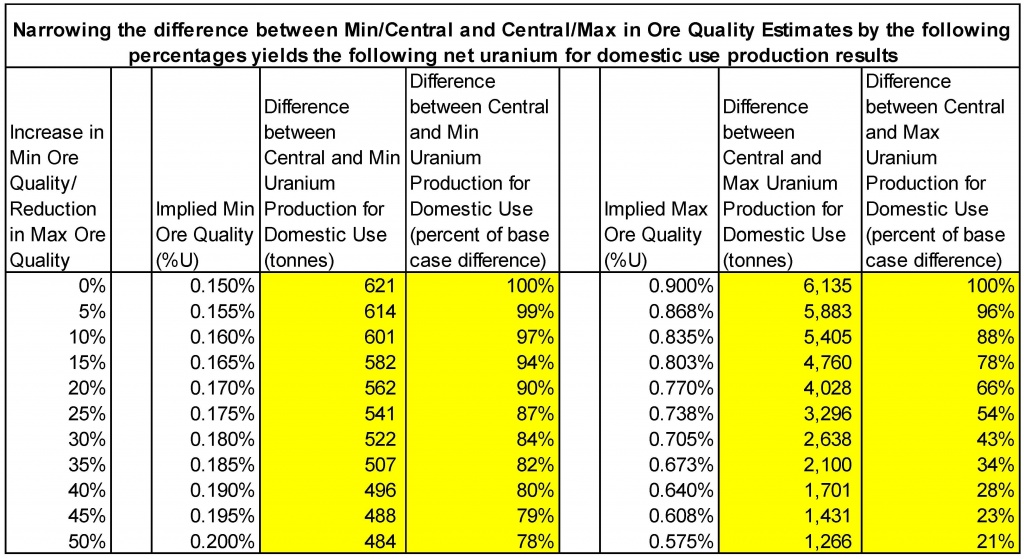
Figure 5 shows the differences, in percentage terms, between uranium production (net of exports), as the differences between the minimum and central and central and maximum estimates of production capacity are reduced. Figure 6 shows how the difference between these pairs of estimates is reduced as the range of estimates of ore quality are reduced.
Figure 5:
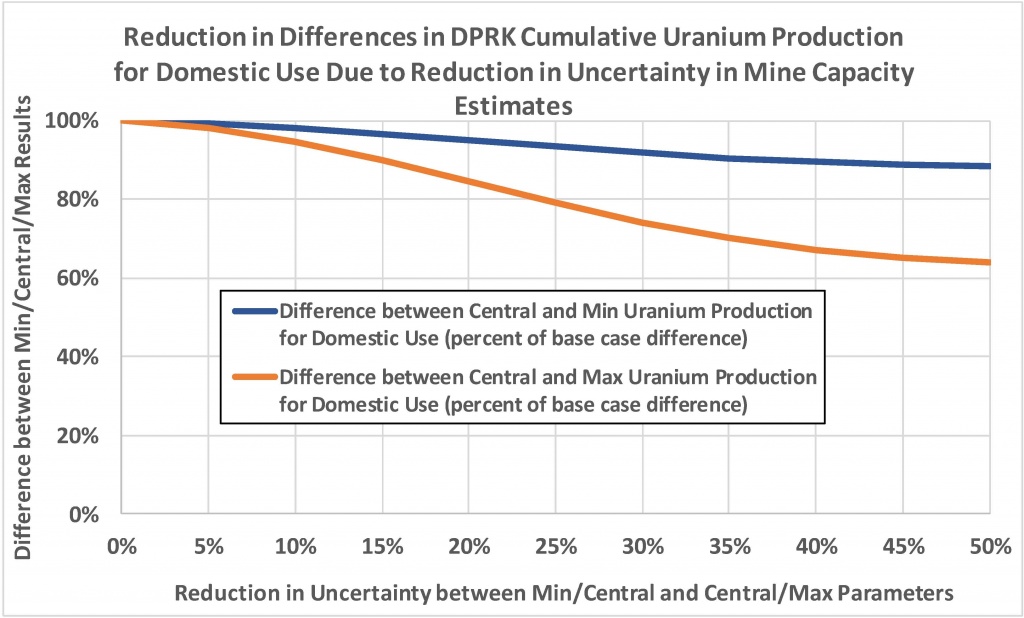
Figure 6:
A key input assumption in these calculations are the annual average capacity factors for different periods (each a decade or more) in which the DPRK produced uranium. These annual capacity factors are our rough estimates and range from 5 percent—of what are assumed to have been the highest capacities achieved by the DPRK over the years—in the early years of production, to up to 50 percent in the 1990s.
Comparison of Top-down and Bottom-up Estimates
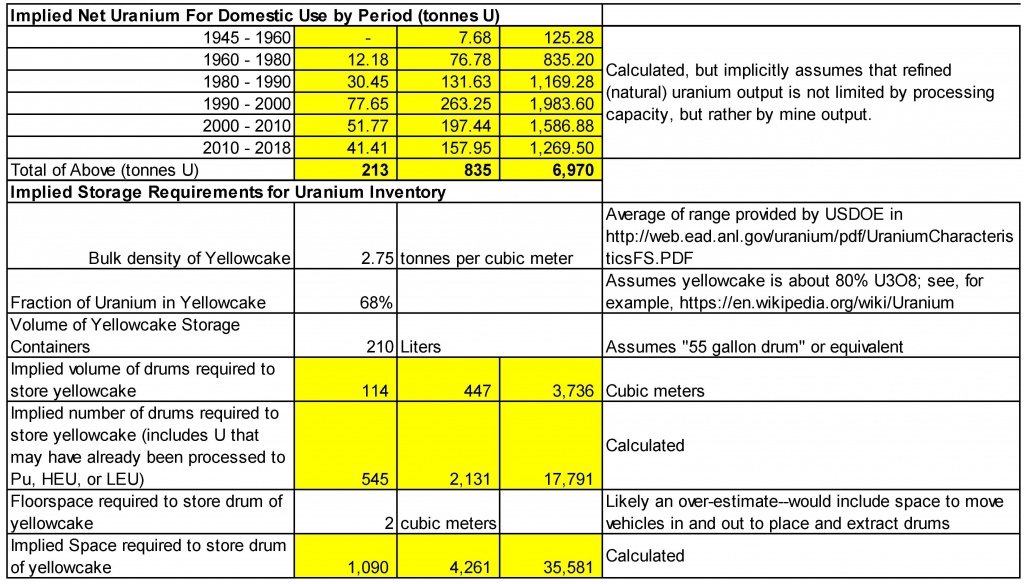
The ranges of the top-down and bottom-up estimates of natural uranium and uranium ore produced above do not match up entirely, but do overlap. Particularly at the low end of the range, for total uranium production as expressed as tonnes of elemental U, the two estimates are relatively close, at near 200 tonnes uranium. The estimates diverge somewhat in going from the “minimum” end of the range through central estimates to the “maximum” values, which could imply uranium in storage as natural (probably refined) uranium. We prepared a rough calculation of the amount of space that might be required to store all of the refined (for example, as yellowcake) uranium produced by the DPRK (net of exports, but including all forms of uranium, and uranium and plutonium that has been used in weapons tests. The space required for uranium storage ranges from 1000 square meters (smaller than the buildings on site at the known uranium refining facilities in the DPRK) to about 40,000 square meters (several such buildings), but in either case is not so large that it would be difficult for the DPRK to conceal the stored uranium.
8.2 Using direct sampling and satellite analysis to reduce the range of uncertainty in key parameters
Direct sampling and satellite image analysis can be used together to reduce the range of uncertainty in a number of key parameters. Perhaps the most important among these is the average ore content of uranium mined in the DPRK. Our guess is that the average value for ore quality is much more likely to be near 0.2 percent than 0.9 percent, as the latter would be quite high and seems to be contradicted by the typical ore qualities in the nations in the area, as well as by Russian reports of ore quality (see above). Although multi-band analysis of satellite imagery may provide some way of assessing the ore quality in uranium mine spoil or in piles of ore waiting to be processed, it is likely that direct access and sampling (of ore, mine spoil, and mill tailings, for example) will be needed to reduce uncertainty in the range of historical uranium output. Satellite techniques for assessing the growth in spoil piles and tailings dumps would ideally be combined with on-the-ground measurements, including cores, to attempt to determine the rate of ore production and uranium refining over time.
8.3 Sensitivity analysis of degree sampling/satellite analysis would reduce range of estimates of existing uranium
Annex 3 provides calculations of how reducing the difference between the minimum and central estimates of key parameters, and between the central and high estimates, can reduce the difference in results. Differences in each of the parameters was reduced by 5 to 50 percent. A reduction of 50 percent in the difference between the minimum and central estimates of uranium mine capacity decreases the difference in uranium production net of export (as U) by about 10 percent, and in uranium ore by about 30 percent. (A reduction in the difference between minimum and central annual capacity factors for mines would have had a similar impact). A reduction of 50 percent between the central and maximum estimates for mine capacity would reduce the difference in tonnes of uranium and uranium ore available for domestic use by about 60 and 40 percent, respectively. Reduction in the differences between the estimates for ore quality by 50 percent reduce the volume of ore needed for non-exported production by about 20 percent (for minimum to central estimates) and by 80 percent for central to maximum estimates. The reduction in the latter is particularly pronounced because the difference between the central and maximum values we assumed for ore quality is large.
9 Conclusions
9.1 Overall current understanding of potential range of historical U production in the DPRK, and of potential net inventories of U
Based on the above, total historical uranium production (net of export) in the DPRK is estimated to be in the range from about 200 to 1000 tonnes of uranium as U, with ore production in the range from tens of thousands of tonnes to up to a million tonnes, with hundreds of thousands of tonnes being more likely, in our opinion.
9.2 Implications for verification tests that should be a part of a negotiated settlement with the DPRK
It will be crucial to obtain a better understanding of ore quality in the DPRK in particular, so sampling of ore bodies, waste piles, and tailings ponds/piles at identified major mines and at uranium processing facilities will be crucial, and should be a part of any negotiated agreement. Satellite image analysis will provide a useful addition to data acquired on the ground, but likely cannot, particularly in the short term, substitute for direct sampling.
9.3 Practical issues associated with verification testing
There are, of course, a wide range of issues associated with reducing the uncertainty of uranium production estimates. These include (but are not limited to):
• Site access—that is, whether the DPRK will allow access to all identified and suspected sites involved in uranium production and processing.
• Hidden facilities, including underground facilities, are widely expected to exist for a variety of military installations, with uranium processing and enrichment among them.
• Sampling error or bias, caused by not being able, through physical or access impediments, or to lack of equipment, manpower, and/or time, to sample all of the relevant parts of a given uranium-bearing stratum, spoils pile, tailing pile, or other input to our output of the uranium industry.
• Access to mining and processing records at all the sites and facilities involved in uranium mining, processing, enrichment, and fabrication.
Maximizing access to sites and records and making arrangements that will allow the minimizing of sampling errors and of missed hidden facilities, as well as reducing, to the extent possible, any other issues likely to limit the effectiveness of verification testing, will be a goal of negotiations on verification protocols.
Annex 1:53
Annex 2:
Annex 3:
1 This working paper is published under a 4.0 International Creative Commons License the terms of which are found here. It is published by Nautilus Institute here; by the Asia-Pacific Leadership Network for Nuclear Non-Proliferation and Disarmament here; and by the Research Center for the Abolition of Nuclear Weapons, Nagasaki University, here
2 See, for example, Jonathan McLaughlin (2017), “North Korea Nuclear Milestones – 1962-2017“, The Wisconsin Project, dated September 29, 2017, and available as https://www.wisconsinproject.org/north-korea-nuclear-milestones/. Other sources refer to a nuclear cooperation agreement signed by the DPRK and Russia in 1959, predated by nuclear prospecting by both the Japanese during World War II and by the Russians as early as 1946.
3 Document in the authors files, referencing a number of Korean and international literature sources [ELE-96]; Andrea Berger (2014), “What lies beneath: North Korea’s uranium deposits: All signs point to Pyongyang regime’s ongoing nuclear program development”, NK News, dated August 28, 2014, and available as https://www.nknews.org/2014/08/what-lies-beneath-north-koreas-uranium-deposits/; and Nuclear Threat Initiative (NTI, 2018), “North Korea, Nuclear”, Last Updated: October, 2018, and available as https://www.nti.org/learn/countries/north-korea/nuclear/. Some of the areas listed may be identified deposits of uranium, but not active mines.
4 Federation of American Scientists, “Hungnam N39°49 E127°37′ Hungnam Chemical Engineering College Hungnam Fertilizer Complex”, available as http://www.fas.org/nuke/guide/dprk/facility/hungnam.htm.
5 Edward Yoon (2011), Status and Future and Future of the North Korean Minerals Sector, Nautilus Institute Special Report dated January 6, 2011, and available as http://nautilus.org/wp-content/uploads/2011/12/DPRK-Minerals-Sector-YOON.pdf.
6 Frank V. Pabian, Peter Makowsky, and Irv Buck (2018), “North Korea’s Uranium Mining and Milling Operations Continue at Pyongsan”, 38 North, dated November 2, 2018, and available as https://www.38north.org/2018/11/pyongsan110218/.
7 NTI (2018), ibid.
8 Jeffrey Lewis (2015), “Recent Imagery Suggests Increased Uranium Production in North Korea, Probably for Expanding Nuclear Weapons Stockpile and Reactor Fuel”, 38 North, dated August 12, 2015, and available as https://www.38north.org/2015/08/jlewis081215/.
9 Source, Google Earth, probably mid-2018, available as https://www.google.com/maps/@38.3175968,126.4333268,594m/data=!3m1!1e3.
10 Source, Google Earth, probably early-2018, available as https://www.google.com/maps/search/Pakchon+Uranium+Concentration+Pilot+Plant/@39.7102568,125.5688776,409m/data=!3m1!1e3.
11 Joseph S. Bermudez, Jr. (2017), Overview of North Korea’s NBC Infrastructure, the US-Korea Institute at Johns Hopkins SAIS, dated June 2017 and available as https://www.38north.org/wp-content/uploads/pdf/NKIP-Bermudez-Overview-of-NBC-061417.pdf.
12 Larry A. Niksch, United States Congressional Research Service (CRS), CRS Issue Brief for Congress: North Korea’s Nuclear Weapons Program, updated January 17, 2006. The same figure is also quoted in Yo-Taik Song, “IN OUR TIMES SERIES, PART 6, The North Korean Nuclear Program: Technical and Policy Issues”, available as http://www.phy.duke.edu/~myhan/ot6-song.html.
13 The DPRK has been highly reluctant to reveal the extent of its deposits of uranium ore and its annual production capacity to the outside world. This same estimate of reserves (26 million tonnes of ore), however, was provided in information from private sources in China and DPRK business contacts compiled by E.Yoon in the Nautilus report referenced above. Much of the discussion of uranium reserves and mining presented here is adapted from Mr. Yoon’s work, which should be consulted by the reader wishing further details and reference sources.
14 North Korea’s Nuclear Weapons Programme, by the International Institute for Strategic Studies, 2006, available as http://www.iiss.org/publications/strategic-dossiers/north-korean-dossier/north-koreas-weapons-programmes-a-net-asses/north-koreas-nuclear-weapons-programme.
15 As just two anecdotal example, an undated (but probably late 1990s) article available on the International Atomic Energy Agency (IAEA) website describing uranium mining in Benxi, in the Northeast province of Liaoning, China (about 150 km from the DPRK border) lists an ore U content of 0.34% U (Zhang Rong, “New Development Stage of China’s Uranium Industry”, available as https://inis.iaea.org/collection/NCLCollectionStore/_Public/33/003/33003339.pdf; and the World Nuclear Association lists Russian mines with ore U contents ranging from 0.05 % to 0.2% uranium, albeit the mines listed are not particularly close to the DPRK (World Nuclear Association (2018), “Russia’s Nuclear Fuel Cycle”, updated May 2018, and available as http://www.world-nuclear.org/information-library/country-profiles/countries-o-s/russia-nuclear-fuel-cycle.aspx.
16 “North Korean Hullabaloo”, by Paul Vos Benkowski, 6 – Nukewatch Pathfinder, Winter, 2006-2007, page 6.
17 Peter Hayes (2004), “North Korea’s Uranium Exports: Much Ado About Something”, dated May 25, 2004, and available as http://nautilus.org/wp-content/uploads/2011/12/Hayes-DPRKuranium.txt.
18 These same values are also quoted in Balazs Szalontai and Sergey Radchenko (2006), North Korea’s Efforts to Acquire Nuclear Technology and Nuclear Weapons: Evidence from Russian and Hungarian Archives, COLD WA R International History Project, Working Paper #53, dated August 2006, and available as https://www.wilsoncenter.org/sites/default/files/WP53_web_final1.pdf.
19 Milan Matolin and Mohamad Tauchid (1987), Report to the Government of the Democratic People’s Republic of Korea: Uranium Prospecting DRK/3/003 Evaluation Mission, dated 15 May, 1987, available as http://www.nautilus.org/DPRKbriefingbook/nuclearweapons/DPRKUraniumProspectingMission-1987.pdf; and Milan Matolin (1990), Report to the Government of the Democratic People’s Republic of Korea: Uranium Prospecting DRK/3/003-04 Laboratory Gamma Ray Spectrometry, available as http://www.nautilus.org/DPRKbriefingbook/nuclearweapons/DPRKUraniumProspectingMission-1990.pdf. In personal communication, Professor Matolin indicated that his mission did not have access to data on ore quality, but he did measure the uranium content of “0.1 percent and up” in uranium ores, though these measurements were made for the purposes of training as part of the mission, and thus do not reflect a DPRK average or even the average for the deposit where the sample was taken.
20 See, for example, Andrea Berger (2014), “What lies beneath: North Korea’s uranium deposits: All signs point to Pyongyang regime’s ongoing nuclear program development”, NK News, dated August 28th, 2014, and available as https://www.nknews.org/2014/08/what-lies-beneath-north-koreas-uranium-deposits/.
21 Monazite is a name for a group of rare earth phosphate minerals, the most common form of which (Monazite-(Ce)) contains Cerium, Lanthanum, Thorium, Neodymium, and Yttrium. Monazite is radioactive, and it seems likely to have been exported in this instance primarily as a source of Thorium, though that is just the authors’ conjecture. A description of Monazite can be found at Amethyst Galleries “THE MINERAL MONAZITE”, http://www.galleries.com/minerals/phosphat/monazite/monazite.htm.
22 “North Korea Profile, Nuclear Exports”, prepared for the Nuclear Threat Initiative by the by the Center for Nonproliferation Studies at the Monterey Institute of International Studies, 2003, and previously available as http://www.nti.org/e_research/profiles/NK/Nuclear/47_1273.html (but that link is now inactive). In retrospect, the reference to “$6 billion worth of uranium ore” seems improbable, as it would imply on the order of tens of millions of tonnes of ore, so perhaps it could be a units error in reporting.
23 Foreign Trade of the DPRK, 1 Jul 2001, and 1 Oct 2002.
24 NUKEWARS, “Moscow Dismisses Rumors on Uranium Deal with Pyongyang” by Staff Writers
Moscow (AFP—Agence France-Presse), Dec 04, 2006; and “NKorea, Russia in secret deal over nuclear talks: report”, Tokyo (AFP) Dec 03, 2006. Available as http://www.spacewar.com/reports/Moscow_Dismisses_Rumors_On_Uranium_Deal_With_Pyongyang_999.html.
25 China Customs statistics as compiled by N. Aden for N. Aden (2006), North Korean Trade with China as Reported in Chinese Customs Statistics: Recent Energy Trends and Implications, as prepared for the DPRK Energy Experts Working Group Meeting, June 26th and 27th, 2006, Palo Alto, CA, USA). Dr. Aden’s paper is available as http://www.nautilus.org/fora/security/0679Aden.pdf. Additional data from https://comtrade.un.org/data (used for 2007 and 1994/1995 values above) show no other reports of trades between the DPRK and any country in HS 2612, uranium and thorium ores and concentrates, from 1990 on.
26 See, for example, chapters 4 through 6 in IAEA (1993), Uranium Extraction Technology, Technical Reports Series No. 359, available as https://www-pub.iaea.org/MTCD/Publications/PDF/trs359_web.pdf.
27 See, for example, Joshua Pollack (2010), North Korea’s Nuclear Exports: On What Terms?, 38 North Special Report 9, dated October 14, 2010, and available as https://www.38north.org/wp-content/uploads/2011/08/38North_SR9_Pollack2.pdf.
28 Jeffrey Lewis, Melissa Hanham, Joshua Pollack, Catherine Dill, Raymond Wang *2017), Open-Source Monitoring of Uranium Mining and Milling for Nuclear Nonproliferation Applications, James Martin Center for Nonproliferation Studies Occasional Paper #34, Middlebury Institute for International Studies at Monterey, dated December, 2017, and available as http://www.nonproliferation.org/wp-content/uploads/2017/12/op34-open-source-monitoring-of-uranium-mining-and-milling-for-nuclear-nonproliferation-applications.pdf.
29 Jeffrey Lewis (2015), “Recent Imagery Suggests Increased Uranium Production in North Korea, Probably for Expanding Nuclear Weapons Stockpile and Reactor Fuel”, 38 North, dated August 12, 2015, and available as https://www.38north.org/2015/08/jlewis081215/.
30 Melissa Hanham, Grace Liu, Joseph Rodgers, Mackenzie Best, Scott Milne, and Octave Lepinard (2018), Monitoring Uranium Mining and Milling in China and North Korea through Remote Sensing Imagery, James Martin Center for Nonproliferation Studies Occasional Paper #40, Middlebury Institute for International Studies at Monterey, dated October, 2018, and available as https://www.nonproliferation.org/wp-content/uploads/2018/10/op40-monitoring-uranium-mining-and-milling-in-china-and-north-korea-through-remote-sensing-imagery.pdf.
31 A full description of these methods is beyond the scope of this paper, but a description of their applications to a similar problem, the analysis of human settlement dynamics, can be found in Ranga R. Vatsavaia and Jordan Graessera (2012), “Probabilistic Change Detection Framework for Analyzing Settlement Dynamics Using Very High-resolution Satellite Imagery”, prepared 7 International Conference on Computational Science, ICCS 2012, published as Procedia Computer Science 9 (2012) 907-916, Elsevier Ltd, and available as https://ac.els-cdn.com/S1877050912002189/1-s2.0-S1877050912002189-main.pdf?_tid=461b1382-df55-48e9-999e-99634d613bfe&acdnat=1548967733_1769df362f4333963288982e4896a1fd.
32 See, for example, Enton Bedini (2017), “The use of hyperspectral remote sensing for mineral exploration: a review”, Journal of Hyperspectral Remote Sensing 7 (2017) 189-211, available from https://periodicos.ufpe.br/revistas/jhrs/article/view/25065/pdf.
33 See, for example, Jose Lim, G. A. Borstad, Leslie N. Brown and Q.S. Bob Truong (2006), A Systematic Approach to Hyperspectral Interpretation of Uranium Mines”, available as https://remote-sensing.aslenv.com/documents/Systematic_Approch_INMM_2006.pdf, and Rodrigo dos Reis, Salles, Carlos Roberto de Souza Filho, Thomas Cudahy, Luiz Eduar do Vicente, and Lena Virgínia Soares Monteiro (2017), “Hyperspectral remote sensing applied to uranium exploration: A case study at the Mary Kathleen metamorphic-hydrothermal U-REE deposit, NW, Queensland, Australia”, Journal of Geochemical Exploration, Volume 179, August 2017, Pages 36-50, available from https://www.sciencedirect.com/science/article/pii/S0375674216301455.
34 Source: Enton Bedini, 2017 (ibid). Original source as cited by Bedini is “Clark R.N., Swayze G.A., Livo, K.E, Kokaly, R.F, Sutley, S.J, Dalton, J.B, McDougal, R.R, Gent, C.A., 2003. “Imaging spectroscopy: Earth and planetary remote sensing with the USGS Tetracorder and expert systems”. Journal Geophysical Research-Planets 108, 44.”
35 S.Chandrashekar, Lalitha Sundaresan, and Bhupendra Jasani (2015), Estimating Uranium Mill Capacity Using Satellite Pictures, dated December 2015, and available as http://eprints.nias.res.in/924/1/R35-2015%20Estimating%20Uranium%20Mill%20Capacity%20Using%20Satellite%20Pictures.pdf.
36 S.Chandrashekar, Lalitha Sundaresan, and Bhupendra Jasani (2015), “Identification of Uranium Mill Sites from Open Source Satellite Images”, dated December 2015, and available as http://eprints.nias.res.in/867/1/R34-2015%20Identification%20of%20Uranium%20Mill%20Sites%20from%20Open%20Source%20Satellite%20Images.pdf.
37 See, for example, IAEA (1990), Manual on Laboratory Testing for Uranium Ore Processing, Technical Report Series # 313, dated June, 1990, and available as https://www-pub.iaea.org/MTCD/Publications/PDF/trs313_web.pdf, for general procedures for uranium ore sampling and analysis.
38 An exception here would be for mines that use a process of in situ leaching (ISL) where an aqueous solution is pumped through ore-bearing rock in a uranium deposit and a uranium-enriched leachate solution is collected. ISL does not appear to have been widely used in DPRK mines to date.
39 See, for example, A.C. Keatley, P.G. Martin, K.R. Hallam, O.D. Payton, R. Awbery, F. Carvalho, J.M. Oliveira, L. Silva, M. Malta, and T.B. Scott (2018), “Source identification of uranium-containing materials at mine legacy sites in Portugal”, Journal of Environmental Radioactivity 183 (2018) 102-111, available from https://www.researchgate.net/publication/322504961_Source_identification_of_uranium-containing_materials_at_mine_legacy_sites_in_Portugal, and Zsolt Varga, Judit Krajko, Maxim Penkin, Marton Novak, Zsuzsanna Eke, Maria Wallenius, and Klaus Mayer (2017), “Identification of uranium signatures relevant for nuclear safeguards and forensics”, Journal of Radioanalytical and Nuclear Chemistry (2017) 312:639-654, available as https://www.ncbi.nlm.nih.gov/pmc/articles/PMC5446562/pdf/10967_2017_Article_5247.pdf.
40 See, for example, Manny Mathuthu and Ntokozo Khumalo (2017), “Developing Nuclear Forensics Signatures and National Nuclear Forensics Libraries for the African Continent: A Case Review for South Africa”, International Journal of Applied Science – Research and Review, 2017, Vol. 4, No 1:1, available as http://www.imedpub.com/articles/developing-nuclear-forensics-signaturesand-national-nuclear-forensics-librariesfor-the-african-continent-a-case-reviewfor-south-af.pdf. This study lists the types of data that forensic signatures for uranium mines can be sourced from as including rare earth elements concentrations (as “these exhibit consistent patterns under varying geochemical conditions”), trace element compositions (which “show the impurities for each uranium processing”), the U-Pb isotopic composition, and Concordia age dating of samples. See also Michael J. Kristo, Amy M. Gaffney, Naomi Marks, Kim Knight, William S. Cassata, and Ian D. Hutcheon (2016), “Nuclear Forensic Science: Analysis of Nuclear Material Out of Regulatory Control”, Annu. Rev. Earth Planet. Sci. 2016. 44:555-79, available as https://www.annualreviews.org/doi/pdf/10.1146/annurev-earth-060115-012309.
41 Ankit Panda (2018) Exclusive: Revealing Kangson, North Korea’s First Covert Uranium Enrichment Site”, The Diplomat”, dated July 13, 2018, and available as https://thediplomat.com/2018/07/exclusive-revealing-kangson-north-koreas-first-covert-uranium-enrichment-site/. See also David Albright and Sarah Burkhard (2018), Revisiting Kangsong: A Suspect Uranium Enrichment Plant, dated October 2, 2018, and available as http://isis-online.org/uploads/isis-reports/documents/Kangsong_Update_2Oct2018_Final.pdf.
42 Image from Google Earth, 2018, https://www.google.com/maps/place/Chollima,+Pyongyang,+North+Korea/@38.9572239,125.6120409,290m/data=!3m1!1e3!4m5!3m4!1s0x357e17cb26380e57:0x624eae2b358f3f13!8m2!3d38.9333992!4d125.5821994.
43 Siegfried S. Hecker, Chaim Braun, and Chris Lawrence (2016), “North Korea’s Stockpiles of Fissile Material”, KOREA OBSERVER, Vol. 47, No. 4, Winter 2016, pp. 721-749, available as http://www.iks.or.kr/rankup_module/rankup_board/attach/vol47no4/14833231665766.pdf.
44 Tails assay and implied uranium inputs estimated by the authors of this report using the online “Uranium Enrichment Calculator” by the WISE Uranium Project, last updated 23 Nov 2009, and available as http://www.wise-uranium.org/nfcue.html.
45 David Albright (2018), “Understanding North Korea’s Nuclear Weapon Capabilities”, presentation dated May 9, 2018, and available as http://isis-online.org/uploads/isis-reports/documents/Albright_North_Korea_slides_for_CTR_talk_may_9%2C_2018_final_pdf.pdf.
46 See, for example, K.K. Rebecca Lai, William J. Broad, and David E. Sanger (2018), “North Korea Is Firing Up a Reactor. That Could Upset Trump’s Talks With Kim”, The New York Times, dated March 27, 2018, and available as https://www.nytimes.com/interactive/2018/03/27/world/asia/north-korea-nuclear.html. This article references work by Jane’s Intelligence Review and the Center for International Security and Cooperation at Stanford University, as well as ISIS.
47 The estimate of the size of the core of the ELWR at Yongbyon is from “Redefining denuclearization in North Korea” by Siegfried S. Hecker, 20 December 2010, Bulletin of the Atomic Scientists, available as http://thebulletin.org/web-edition/features/redefining-denuclearization-north-korea-0.
48 See, for example, Oak Ridge National Laboratory (ORNL, 2009), Model of a Generic Natural Uranium Conversion Plant-Suggested Measures to Strengthen International Safeguards, Report # ORNL/TM-2008/195, dated November 2009, and available as https://info.ornl.gov/sites/publications/files/Pub13143.pdf.
49 David Albright (2017), “North Korea’s Nuclear Capabilities: A Fresh Look”, presentation dated April 22, 2017, and available as https://isis-online.org/uploads/isis-reports/documents/North_Korea_Talk_April_28_2017_Final.pdf.
50 Jun Ji-hye (2017), “N. Korea can make 10 nuclear bombs”, Korea Times, updated 2017-01-11, and available as http://www.koreatimes.co.kr/www/news/nation/2017/01/116_221866.html.
51 This figure is based on figures estimated from the late 1980s/early 1990s operating history of the reactor as declared by the DPRK, and presented by ISIS (undated, but after 2006), in “ISIS Course, Introduction to Reactors and Fuel Cycle: Small Yongbyon Nuclear Reactor”, available as http://isis-online.org/uploads/conferences/audio-video/Yongbyon_reactor_and_fuel_cycle_october_16_2014_-_3-2.pdf.
52 Jeffrey Lewis (2017), “The Game Is Over, and North Korea Has Won”, Foreign Policy, dated August 9, 2017, and available as https://foreignpolicy.com/2017/08/09/the-game-is-over-and-north-korea-has-won/.
53 The calculations performed by the “WISE Enrichment Calculator” follow the equations provided in the Wikipedia article “Separative work units”, last edited 28 August 2017, and available as https://en.wikipedia.org/wiki/Separative_work_units. The “Implied tonnes natural U in feed for HEU production” in the table above is calculated for each of the three cases as (Tonnes Natural U feed per kg HEU, as obtained from the WISE Enrichment Calculator for the U-235 tails percentages shown) * (Estimated 2018 HEU inventories (kg HEU))/(1 – Conversion Losses, Enriched UF6 to HEU metal).


